
Merry Christmas-time and happy new year! I’ve been a bit busy the last couple of months with GopherconAU (which was a great success), etc. I’ve got a large list of blog topics to do, but one thing that drew a lot of interest at GopherCon was a lightning talk on flame graphs by the legend himself Brendan Gregg.
It seems that a lot of Gophers have trouble understanding and using Go’s performance analysis tools including flame graphs. This is a shame as they are fantastic for understanding performance issues.
So I’m going to explain the options and demonstrate the simplest way to generate useful flame graphs. If you just want to quickly find out how to generate a flame graph then see the Simple Steps. OTOH if you want more details, plus links to full explanations, see the Background section next.
Part of the confusion is that Go comes with several different tools for analysing runtime performance including benchmarks, sample-based profiling (pprof tool), the execution tracer (trace tool), etc. Moreover, there are also several different types of profiling. If you are unclear, I have clarified all this in the Background->Go section below.
Today, I’m just looking at profiles - specifically, CPU profiles - how to generate, view and understand them using flame graphs.
Warning Traditionally, flame graphs grow upwards, often tapering to points (hence the name). However, the flame graphs images below grow downwards. Don’t be confused by “vertical” words (top, plateau, etc) which are inverted.
Background
General
Pprof
Pprof started life (more than 2 decades ago) as part of the gperftools (Google Performance Tools) suite which were mainly written in C++, though Pprof itself was a Perl script I think. After being used with the Go project for many years it was rewritten in Go with many improvements. The original (deprecated) version is still available at gperftools.
Pprof is used to analyse profiles consisting of stack traces. When written to file they usually have a .pprof extension and are stored in a compressed format of Protocol Buffers. See pprof on github. Profiles can store stack traces related to any useful run-time statistics and are commmonly used for CPU and memory profiles.
Pprof provides many options and reports but originally visualization was only provided by generation of a GraphViz .dot file, but now provides flame graphs!
Pprof documents and reports use the terms flat and cumulative to mean the amount of time spent in a function not including (flat) and including (cum) time spent in callees (functions called from the function). Note that when I mention functions I also mean Go methods.
Graphviz
GraphViz provides a simple and effective way of visualizing graphs** written in the .dot text format. In its most basic form .dot files are very simple to generate and understand. (Though the full DOT language is more complicated - see DOT language)
GraphViz (using .dot files) is traditionally the way that Go CPU profiles are visualized. It displays a directed graph, where nodes represent functions and vertices function calls. Each vertex pointing to a node represents the callers of the function and vertices exiting the node are the callees. Leaf nodes are functions that do not call any other functions (i.e. they have no callees).
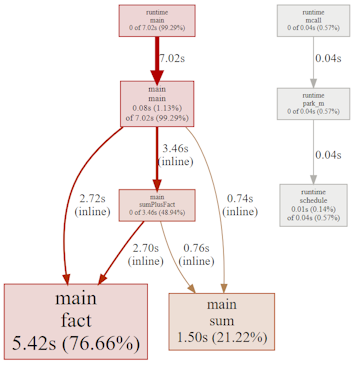
Here is the graph from the Example Code discussed later. The node size shows CPU time spent in the function. This makes it easy to see where the CPU time is being taken, such as fact() and sum().
See CPU Profile for another example.
** Graphs in this case refers to the specific vertex+edge graphs of Graph Theory. On the other hand flame graphs use a type of “graph” that is more like a bar chart.
Flame Graphs
Many people prefer flame graphs which were specifically invented to visualize performance profiles (not necessarily for Go). They were invented about a decade ago by Brendan Gregg. You won’t need the source code, but it is available from GitHub.
The horizontal axis shows the (cumulative) time spent in a function while the vertical axis represents the depth of the call stack. The tips of the flames are functions that do not call other functions.
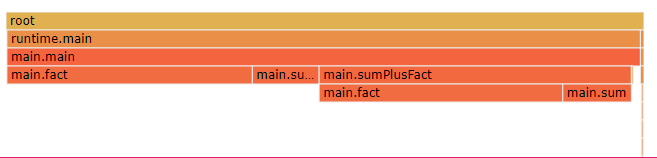
Here is a flame graph (from the same Example Code) as shown in the pprof tool web GUI. (A flame graph, like this, where the flames point downwards, is sometimes called an icicle graph.) I explain below how to use flame graphs with Go CPU profiles.
The horizontal axis of a flame graph represents the amount of time spent in each function, but is not shown in chronological order.
Go
Go comes with many tools that can be used to find and analyse performance (and other runtime) issues. Here is a brief overview of them all, so you understand how CPU profiling fits into the picture.
I hope to get around to discussing the execution tracer, benchmarking and the other types of profiling at a later date.
Benchmarks
Among other things the Go test tool allows you to run benchmarks on a function or other small piece of code. See How to write benchmarks - Dave Cheney for details.
Typically, you use benchmarks on small pieces of code that will be executed often. You may have created a package and are aware of a function or method that you know will be called a lot. Or you may have identified (using CPU profiling) a bottleneck in a low-level piece of code.
In these situations you can benchmark alternatives to find a faster implementation.
Warning: Be careful to benchmark on all target platforms as the relative speed of code may vary significantly between architectures. (Also take heed of other recommendations in Dave Cheney’s blog above.)
Benchmarks can also be useful for finding performance regressions on critical areas of the code. That is, you can re-run benchmarks (on the same hardware), after making code changes, to ensure there is no unintended loss of speed.
Note: You can use flame graphs with your benchmarks, to understand more about where the benchmarked code may be slow. For this you need to generate a CPU profile using the -cpuprofile option of the test tool.
Warning: Don’t optimize code if it makes the code more complicated or harder to understand unless you are sure it is causing a performance issue. You probably should profile the code first (as discussed below). Most of the time the problematic code will not be where you think.
Profiling
The way Go generates CPU profiles is like most runtime profilers. It samples what the CPU is doing 100 times/second. You typically save these samples to file and later inspect them using the pprof tool or visualise them, e.g. with flame graphs as explained later.
Go also allows you to generate other types of profiles for other, usually more specialised, purposes. Since we are looking at performance this article is just about CPU profiles. However, other types of profiles, especially heap profiles, can be useful for understanding and fixing some performance issues.
Just for completeness here are the other types of profiles and a short description:
- heap - use to understand how memory is allocated and garbage collected
- threadcreate - you’re unlikely to need this
- goroutine - stack traces of all goroutines
- block - useful for synchronisation problems such as deadlocks
- mutex - synchronisation problems involving mutexes
See the Go Blog Profiling Go Programs - Russ Cox for more details. Note that (except that it does not cover flame graphs), this is still relevant despite being written in 2011.
Also see: Dave Cheney - GopherCon 2019.
Execution Tracer
At a somewhat lower level is the Go trace tool. Unlike profiling, it doesn’t sample your code, but records everything that your goroutines are doing. It allows you to see when and where (which thread) goroutines are active, plus how they interact with each other and the garbage collector.
This is a brilliant tool which AFAIK is unique to Go. It allows you to understand how your code is working at a low level. This is perfect for understanding interactions in highly concurrent software, including performance issues.
Note: The execution tracer is not to be confused with tracing packages like golang.org/x/net/trace (from the Go authors) or Open Telemetry (from the Open Telemetry Project). It’s a low-level facility requiring no code changes (except, perhaps, to invoke it). For example, Open Telemetry allows you to instrument your code allowing you to follow the flow of data through the application, though you can use it to automatically generate traces for some packages (but not runtime).
Other Go Runtime Information
The standard library runtime, runtime/metrics and debug packages allow you to get information about what the runtime is doing, such as metrics and statistics about goroutines, memory allocations/collections etc.
The GODEBUG environment variable can be set to a string of
See Go Diagnostics for more on runtime.NumGoroutine(), runtime.ReadMemStats(), debug.ReadGCStats(), debug.Stack(), GODEBUG, etc.
Generating CPU Profiles
There are several different ways to generate profiles in Go. You can generate and analyse them on the fly, but I find it better to save to a .pprof file for later analysis.
Warning: To avoid misleading results only run one type of profile at a time. When generating a CPU profile do not simultaneously generate a heap profile or run the execution tracer as this will mess with your measurements.
The runtime/pprof package
To programmatically control exactly what code you are profiling you need to use the standard library runtime/pprof package. Call pprof.StartCPUProfile() to start CPU profiling and pprof.StopCPUProfile(). You need to pass an io.Writer (usually just a file open for writing) to pprof.StartCPUProfile(). For example:
    f, err := os.Create("cpu.pprof")
    if err != nil {
        panic(err)
    }
    defer f.Close()

    pprof.StartCPUProfile(f)
    defer pprof.StopCPUProfile()
    // code to profile
All goroutines of the process are profiled until StopCPUProfile() is called. If there are other running goroutines then their code will also be profiled. If you just want to profile code in one goroutine (ie, just the above // code to profile) then you need to somehow suspend other goroutines or avoid creating them.
Once you have created the cpu.pprof file you can analyse and visualize it as discussed in Inspecting Profiles.
The net/http/pprof package
A convenient way to generate profiles (especially if your application already includes a web server) is to use the other pprof package in the Go standard library: net/http/pprof. Once imported, you can generate profiles at any time with a simple HTTP request.
Warning: Many servers import the runtime/pprof package to assist diagnosing problems in production, since there is very little performance impact (except while generating a profile). However, there are security issues that you should be aware of. The generated stack traces may expose sensitive data. Plus anyone can generate a profile and slow the system which could be used for a DOS attack. See Your pprof is showing for details and how to address the issues.
If you are running the default web handler then you don’t have to do anything but import the package! (The net/http/pprof package’s init() function hooks into the default web-server.)
import (
    _  net/http/pprof
)
This registers http endpoints like these (and possibly others):
- http://localhost:6060/debug/pprof/profile
- http://localhost:6060/debug/pprof/heap
- http://localhost:6060/debug/pprof/block
- http://localhost:6060/debug/pprof/mutex
- http://localhost:6060/debug/pprof/trace
If your code does not already have a web-server then you can create one (e.g. on localhost:6060) with this code: go http.ListenAndServe(":6060", nil)). See Writing Web Applications for details.
Caution: Confusingly, not all debug/pprof paths are for profiling. The debug/pprof/trace path runs the execution tracer not a profiler (see Background section above for details on Go’s execution tracer tool), which generates a trace, not a profile.
Also note that if you are not running the default web-server then you will have to register your own handler for the CPU profiler like this:
import (
    pprof  net/http/pprof
)
...
    mux.HandleFunc("/debug/pprof/profile", pprof.Profile)
Once the application (including the webserver) is running you can use one of the above HTTP endpoints to generate a profile, e.g. using curl. Since we want a (5 second) CPU profile we use /debug/pprof/profile, then use the pprof tool to inspect it like this:
$ curl --output cpu.pprof http://localhost:6060/debug/pprof/profile?seconds=5
  % Total    % Received % Xferd  Average Speed   Time    Time     Time  Current
                                 Dload  Upload   Total   Spent    Left  Speed
100   527  100   527    0     0    104      0  0:00:05  0:00:05 --:--:--   138

$ go tool pprof cpu.pprof
Type: cpu
Time: Dec 24, 2023 at 10:14pm
Duration: 5.01s, Total samples = 10ms (  0.2%)
Entering interactive mode (type "help" for commands, "o" for options)
(pprof) ...
As mentioned above, you can generate and analyse a profile in one step:
$ go tool pprof http://localhost:6060/debug/pprof/profile?seconds=5
Fetching profile over HTTP from http://localhost:6060/debug/pprof/profile?seconds=5
Saved profile in <UserPProfDirectory>/pprof.samples.cpu.004.pb.gz
Type: cpu
Time: Dec 24, 2023 at 10:19pm (AEDT)
Duration: 5.01s, Total samples = 10ms (  0.2%)
Entering interactive mode (type "help" for commands, "o" for options)
(pprof) ...
Dave Cheney’s Profile package
I use Dave’s wrapper for the standard library runtime/pprof package. All you need to do is execute defer profile.Start().Stop() at the top of the function you want to profile.
By default, it creates a CPU profile in your “TEMP” directory. I use the profile.ProfilePath(".") option to write the profile to the current directory like this:
package main

import "github.com/pkg/profile"

func main() {
    defer profile.Start(profile.ProfilePath(".")).Stop()
    // code to profile
}
You should see something like this when you run it.
$ go run main.go
2023/12/25 17:12:29 profile: cpu profiling enabled, cpu.pprof
2023/12/25 17:12:30 profile: cpu profiling disabled, cpu.pprof

$ go tool pprof cpu.pprof
...
I can’t see how it could be much simpler, but see Simple Profiling Package for more info.
It’s recommended to use github.com/pkg/profile package rather than the earlier github.com/davecheney/profile, which is deprecated.
The test tool
When benchmarking using the Go test tool it may not be obvious where the problem is if there is a performance issue. You could experiment by modifying the benchmark code, but it may be simpler and faster to just run a CPU profile on the benchmark itself. This is easily achieved using the -cpuprofile command line flag.
$ go test -bench=. -cpuprofile cpu.pprof

$ go tool pprof cpu.pprof
Converting From Other Formats
Another way to get a .pprof file is to convert output from the Linux profiler perf. See perf_data_converter.
You can also generate a CPU profile if you already have an execution trace file using trace tool.
Inspecting Profiles
There are lots of ways to examine profiles (.pprof files) most of which involve the Go pprof tool, such as:
- use options like
-topand-peekfor a text report - use
-png,-svg,-pdf, etc to visualize as a graph - use
-dot,-callgrind, etc. - convert to a different format - without options to invoke an interactive CLI tool
- use
-httpfor a web GUI (incl. flame graphs!)
You can also generate or view a flame graph directly from a .pprof file, as I explain later.
Pprof Text Reports
The pprof tool outputs a text report when you use the -text, -top, -peek, etc. command line flags. These have the same information as the corresponding commands in the interactive CLI.
$ go tool pprof -top cpu.pprof
...
Duration: 3.42s, Total samples = 3.25s (95.13%)
Showing nodes accounting for 3.22s, 99.08% of 3.25s total
Dropped 12 nodes (cum <= 16.25s)
      flat  flat%   sum%        cum   cum%
     3.14s 96.62% 96.62%      3.14s 96.62%  main.fact (inline)
     0.08s  2.46% 99.08%      0.08s  2.46%  main.sum (inline)
         0     0% 99.08%      3.22s 99.08%  main.main
         0     0% 99.08%      1.51s 46.46%  main.sumPlusFact (inline)
         0     0% 99.08%      3.22s 99.08%  runtime.main
Pprof Call Graphs and Other File Formats
The -gif, -pdf,-png,-ps, -svg, etc command line flags of pprof tool generate a visual call graph.
A more useful call graph can be generated using the -dot command line flag. This requires GraphViz (not part of the Go installation) but it’s a useful program to have anyway. See the section on GraphViz in the Background above.
The -callgrind flag is used to generate a callgrind file. This could be useful if you are used to working with callgrind utilities. See callgrind for more information.
Pprof Interactive CLI
In interactive (CLI) mode pprof provides a lot of commands, but you will probably only ever use the top and the peek commands, so I briefly explain those. Many of the other commands are for generating different profiles or graphs in different file formats, which can be done from the command line anyway (see above).
Top command
The top command shows the 10 (by default) most expensive functions. For CPU profiles this means the functions that used the most “flat” CPU time, or time in the function not including callees (functions called from it). If you want to see the top functions by CPU time including callees use the –cum option
$ go tool pprof cpu.pprof
Type: cpu
Time: Dec 24, 2023 at 10:14pm
Duration: 5.01s, Total samples = 10ms (  0.2%)
Entering interactive mode (type "help" for commands, "o" for options)

(pprof) top 5 --cum
Showing nodes accounting for 3220ms, 99.08% of 3250ms total
Dropped 12 nodes (cum <= 16.25ms)
Showing top 5 nodes out of 8
      flat  flat%   sum%        cum   cum%
         0     0%     0%     3220ms 99.08%  main.main
         0     0%     0%     3220ms 99.08%  runtime.main
    3140ms 96.62% 96.62%     3140ms 96.62%  main.fact (inline)
         0     0% 96.62%     1510ms 46.46%  main.sumPlusFact (inline)
      80ms  2.46% 99.08%       80ms  2.46%  main.sum (inline)
Flat time: time spent in a function is called the flat time. The sum of all the flat times will be 100%, but in the table above it’s 99% as we’re only looking at the top 5.
Cumulative time: flat time plus time in sub-functions (callees) is cumulative time which means main() is usually at the top as everything (except initialisation) runs beneath it.
Peek command
The peek command shows a function (or functions matching a regular expression) plus their callers and callees. It shows relative amounts of time spent in each of the callees. This can be useful to see where a function is spending most of its time.
(pprof) peek fact
Showing nodes accounting for 3.25s, 100% of 3.25s total
----------------------------------------------------------+-------------
      flat  flat%   sum%        cum   cum%   calls calls% + context
----------------------------------------------------------+-------------
                                             1.63s 51.91% |   main.main (inline)
                                             1.51s 48.09% |   main.sumPlusFact (inline)
     3.14s 96.62% 96.62%      3.14s 96.62%                | main.fact
                                             0.01s  0.34% |   runtime.asyncPreempt
----------------------------------------------------------+-------------
Here we can see that fact() is called from main() and sumPlusFact() and only calls runtime.asyncPreempt().
Web command
The web command opens a visual graph in your web browser. This is just a simple graph and is not the same as (and not as useful as) the Interactive Web UI discussed next.
Pprof Web UI
If you specify the -http <address> option to the pprof tool then an interactive web page is created. If you then open it in your web browser you will see many useful options in the drop-down menus including:
- View/Top - top CPU functions - like Top Command
- View/Peek - like CLI Peek Command
- View/Graph - displays a GraphViz call graph
- View/Flame Graph - displays a flame graph
- View/Source - source code listing with times
- View/Disassemble - assembly code listing
$ go tool pprof -http :6060 cpu.pprof
Serving web UI on http://localhost:6060
Many people (including me until recently) are unaware that the web GUI of the Go pprof tool has supported flame graphs for several years!
Flame Graphs
There are many different ways to view a flame graph once you have a CPU profile, but the simplest way is just to drag your .pprof file onto http://flamegraph.com/ (thanks Gary for finding this one :) or https://www.speedscope.app/.
For completeness here are the ways you can use flame graphs with Go:
- When I first used flame graphs I had to run a Perl script to create a flame graph from a .pprof file
- the script is downloadable from github.com/brendangregg/FlameGraph
- this requires you to have Perl installed
- Uber provides Go Torch to generate profiles and view a flame graph
- using the containerised version is simplest but requires docker to be installed
- see Profiling Go Applications with Flame Graphs for details
- Use the flame graph(s) provided by interactive web UI of the pprof tool as described above.
- Upload the file to http://flamegraph.com/
- Drop the .pprof file on https://www.speedscope.app
Flame Graph Example
Go Code
To demonstrate, I wrote a test program (see below) with three functions - fact(), sum() and sumPlusFact(). I call them millions of times in a loop to ensure that I get a good number of samples.
Note: I had to increase the loop count more than expected. With smaller values the resulting profile showed nothing of use as only 1 or 2 samples were taken. If you try this code on a fast system, you may need to increase it even more than 2e8.
package main

import (
  "fmt"
  "github.com/pkg/profile"
)

func main() {
  defer profile.Start(profile.ProfilePath(".")).Stop()

  var i, s, f, sf int
  for i = 0; i < 2e8; i++ {
    s = sum(20)
    f = fact(20)
    sf = sumPlusFact(20)
  }
  fmt.Println(s, f, sf)
}

func sumPlusFact(n int) int {
  return sum(n) + fact(n)
}

func sum(n int) int {
  r := 0
  for i := 0; i <= n; i++ {
    r += i
  }
  return r
}

func fact(n int) int {
  r := 1
  for i := 2; i <= n; i++ {
    r *= i
  }
  return r
}
Generating the Flame Graph
To view the flame graph, run the program and then open the resulting profile in the pprof tool web GUI (ie, at http://localhost:6060 for this example).
$ go run main.go
2023/12/31 12:26:15 profile: cpu profiling enabled, cpu.pprof
210 2432902008176640000 2432902008176640210
2023/12/31 12:26:31 profile: cpu profiling disabled, cpu.pprof

$ go tool pprof -http :6060 cpu.pprof
Serving web UI on http://localhost:6060
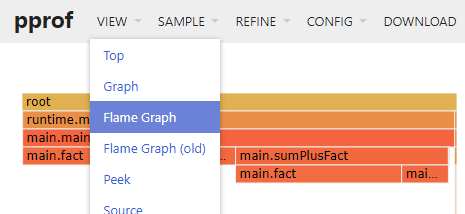
Then select Flame Graph from the View menu.
Execution Times
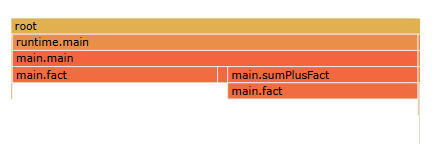
The width of a block, such as main.main represents the cumulative time spent in the function. It is expected that main() extends nearly the whole width (apart from a small part for the Go runtime code). However, most of the cumulative time for main() is spent in calls to fact(), sum() and sumPlusFact().
The flat time for main() [1.13%] is that small area to the right of the main.sumPlusFact block where there is nothing “above” the main.main block. This is the overhead of the for loop.
Note that none of the profile samples caught the execution of fmt.Println(), as it’s only called once and is fairly quick.
Optimizing the Code
Of course, the above sum() function could be made a lot faster like this:
func sum(n int) int {
    return (n * (n + 1)) / 2
}
With this change sum() is so fast that none of the samples captured its execution. Now fact() consumes about 90% of the time, since the program runs almost twice as fast as it did before.
Understanding Flame Graphs
Flame graphs make it easy to see where CPU time is being consumed simply by looking at the width of the boxes. It also make it easy to see the relationship between callers and callees and compare their flat and cumulative times.
Block Width
The first thing to look for is wide blocks, indicating that the CPU is spending a lot of time in a function. A wide block says that the function is being called many times and/or each call is taking a long time.
If doing a lot of unnecessary calculations (e.g. a long-running loop) this will appear as an unexpected “plateau” in the flame graph - ie, a flat area at the “top” of the graph with no block(s) above - that is, large flat (not cumulative) time as in main.fact() above.
Alternatively, if an unexpectedly wide block has lots of blocks above it (large cumulative time) then you need to carefully check the called functions to find anything unnecessary, such as excessive logging, or functions that could be optimized. A problem I have seen a few times is a “loop+select” where the flame graph shows a lot of time executing the runtime/selectgo() function (which is used in the implementation of the select statement) with code like this:
    for {
        select {
        case <-ch:
            // handle cases
        case <-ctx.Done():
            return
        default:
            // do something (or nothing) is all cases are blocked
        }
    }
The problem with this is the goroutine will enter a “busy loop” if all the channels are blocked. Generally, this indicates that you need to reconsider how the channels are handled. (If nothing better occurs to you then at least just add a time.Sleep() to the default: case.) Alexander Else gave a great example of this problem at GopherconAU - Profiling a Go service in production.
Block colours
Generally, the colour of flame graph blocks doesn’t mean anything, except the same function in different call stacks will have the same colour. Sometimes, blocks have very different colours or hues to indicate something significant such as different languages or execution environments.
Samples
You can use flame graphs without understanding how they are created, but it may be useful to understand how they are built from samples. The Go profiler collects a sample every 10 msecs (by default). Each sample is essentially a list of stack frames including the name of all functions in the call stack.
Since inlined functions are not normally recorded in a call stack you might think they are not shown. Using some special magic the Go CPU profiler retains inlined functions in the call traces! So don’t use the //go:noinline directive (which would distort the CPU profile).
Note: Samples for CPU profiles are taken at 100 Hz (100 times/second). This can be adjusted using runtime.SetCPUProfileRate(). You might want to change it if you are getting interactions with other events that occur at the same rate (or multiple thereof). For example, I had a message sent to the server exactly every 100 ms which caused greatly varying CPU profiles simply because of the timing. Warning don’t use runtime.SetCPUProfileRate() before Go 1.18.
When a flame graph is generated, it groups all samples that have the same call stack together. So the horizontal axis shows the CPU time, but because of the grouping the X-axis is not in chronological order. The inventor of flame graphs explains why this grouping is so useful in this video: Visualizing Performance - The Developers’ Guide to Flame Graphs.
Each block of a flame graph represents all calls of a function with the same ancestry (call stack). The block immediately below is the parent (caller) and block(s) above are the child(ren) or callee(s). But don’t forget that if a function executes quickly and is called rarely then it may never be seen in a profile, because it was lucky enough to never be sampled.
In the pprof tool web GUI you can choose to see the number of samples for each block (rather than CPU time) by selecting the samples item from the SAMPLE drop-down menu. To see the number of samples hover the mouse over the block. WARNING: If the root block (at the bottom of the graph) does not have enough samples then the flame graph will not be very useful.
Flame Graphs vs Call Graphs
Many developers prefer flame graphs to call graphs as they are less cluttered and give a better indication of the relationship between callers and callees. For example, compare the call graph below with the flame graphs above.
The code starts no goroutines so all the interesting calls start from main() (apart from things associated with the Go runtime or other packages).
Note: Generally, you can just ignore functions beginning with runtime in the graphs (but if using a lot of CPU they may indicate a performance issue). You can also ignore asyncPreempt() which is often seen in the tips of flame graphs – but these calls seem to have been hidden in CPU profiles as of Go 1.22.
Simple Steps
There are lots of ways to use flame graphs. Here are simple steps to effectively use them for performance issues.
Generate a CPU profile
The first step is to generate a Go CPU profile in a .pprof file. There are two different scenarios where I would either use the runtime/pprof package or the net/http/pprof package.
There are ways to generate and view flame graphs in a single step. I find it is better to retain the CPU profile in a file for reproducibility and later reference.
runtime/pprof
Most of the time, you know if you have a performance problem, and have a rough idea of where it is happening. In this case, it is a simple matter of wrapping the problematic code in calls to pprof.Start() and pprof.Stop() to generate a profile and write it to disk.
In a highly concurrent program you may have a performance issue in a single goroutine and all the other, unrelated code will muddy the results. In this case you may need to find a way to suspend them or avoid creating lots of goroutines, to test the problem area in isolation. Setting GOMAXPROCS to 1 may or may not help.
For simplicity, I just use the github.com/pkg/profile package as explained above in the Dave Cheney’s Profile package.
net/http/pprof
A common scenario is a continuously running production server where occasionally something triggers the whole server to slow down - for example causing large latencies in requests. It is usually not immediately, or not at all, obvious what data/request is triggering the problem.
Many such backends are/have a web-server (or can easily have one added). Thence, it is just a matter of importing the net/http/pprof package. When the issue is noticed in production you can manually generate a CPU profile with a simple HTTP request.
Note that importing the net/http/pprof package typically has negligible impact on server performance until you request a profile (in which case you probably already have a performance issue anyway). But see the above Generating CPU Profiles: net/http/pprof package section for details, especially the security warning.
Create a flame graph
Once you have a CPU profile (in a .pprof file) you can use the Web GUI facility in the Go pprof tool web GUI like this:
$ go tool pprof -http :  cpu.pprof
Serving web UI on http://localhost:53947
then open the flame graph from the VIEW drop down menu.
OR drop your cpu.pprof file onto https://www.speedscope.app/ or https://flamegraph.com/ in you web browser.
Identify Performance Problems
Finally, look for blocks in the flame graph that are unexpectedly wide, which indicates that a function is being called a lot OR it is taking a long time to run. If the function has other blocks above then the problem may be in one or more callees.
The Go pprof tool designates times as flat and cumulative. Other language and flame graph tools may use other names such as self and total. Self (flat) is the time spent in a function; total (cumulative) is the time spent in the function and the functions that it calls. The same function may appear in different call stacks with different self and total times.
CPU time is taken in the topmost blocks of the flame graph. That is, the leaf nodes of the call tree (functions that don’t call other functions), but also (where a block has some callees but these callees represent a small proportion of the function execution time) if the function’s “flat” time is a large proportion of its “cumulative” time. So look for large “plateaus”. If there are no such areas (ie, the graph has lots of small sharp tips) then you may not be able to find any performance improvements, or there could be a myriad of problems :(.
Most flame graph viewers allow you to see more information about a block such as the flat and cumulative times and the number of samples that hit that function. You may also be able to click a block to zoom in on it.
See Understanding Flame Graphs above for more.
Conclusion
Flame graphs are great for understanding the performance of your software.
The hardest part may be generating a CPU profile of the relevant code. If you know where the problem is call the profiler directly using the runtime/pprof package. For long-running servers import the net/http/pprof package so you can generate a profile at any time with a simple HTTP request.
Once you have a profile (in a .pprof file) you can easily view it in the pprof tool web UI - see (Create a flame graph)[#create-a-flame-graph] or by dragging it onto a page like flamegraph.com.
Comments