
Profile Guided optimisation
PGO is a recent addition to Go which helps your code to run faster.
If you’ve already heard of it you may have thought: Why bother? – it’s probably hard to use and won’t make the code much faster.
Well, if you write code that is used in a lot of “instances” even using 10% less CPU can reduce use of resources (electricity, hardware, etc). Moreover, it can provide a noticeable improvement in responsiveness.
But the really nice thing is that (unlike PGO in other languages) Go makes it easy to use. For example, you can profile code as it is running in production and use the profile as the input to the next (PGO enabled) build, as long as the code has not changed significantly.
One caveat is that you need decent CPU profiles to get the best results, which I discuss in Profile Collection Guidance later.
Background
General
Why Compilers Generate Slow Code
When I first learnt PDP-11 assembler programming, a lot of my fellow students were saying that it was pointless since soon optimising (Fortran!) compilers would make assembler programming obsolete. Over the next 4+ decades, lots of people have said that optimising compilers (for Fortran, C, Rust, …) will produce better code, than handwritten assembler, but it has never happened. People always write faster code (at least for the small benchmarks that are used to test this).
Of course, large scale development is better with a high-level language. Many large projects would just take too long if entirely written in assembler, and would be overwhelmingly complex without the support of high-level language features.
There are two reasons for this.
-
A compiler is a “general purpose” tool since it needs to be able to handle an enormous variety of inputs (source files). Handwritten assembler can be tailored exactly for the problem at hand. In other words, something created for a specific purpose is always going to be better than an adapted general purpose solution. A racing car is faster around a track than a general purpose vehicle.
-
The developer writing the code will have an understanding of how the code will execute which is not conveyed through the source code. Indeed, an experienced assembler programmer may not even be consciously aware of why she writes code in a particular way.
(Though, thinking about it, maybe these are the same reason stated in 2 different ways.)
As a simple example, consider this Go code that iterates over a slice:
    for _, t := range tags {
        if t == tag {
            break
        }
    }
Here is some “assembler” that could have been generated from this code.
Note This code is for a fictitious assembler – I hope the op-code meanings are obvious: BEQ = branch if equal, etc. The “variables” i and t represent registers, while tag and tags are memory locations.
start:
   MOVE i, 0          // init loop counter
   COMP i, len(tags)  // check if end of loop
   BEQ  end
   MOVE t, tags[i]    // get range var 't'
   COMP t, tag        // check if equal to tag
   BEQ  end
   INC  i             // increment loop counter
   BRA  start         // go back to start
end:
   ...
If the assembler was instead hand-coded it may be known that the slice is almost always empty. Changing the code to use BNEQ (branch not equal) is better as CPUs are generally faster for the “untaken” branch.
start:
   MOVE i, 0
   COMP i, len(tags)
   BNEQ loop
end:
   ...

loop:
   MOVE t, tags[i]
   COMP t, tag
   BEQ  end
   INC  i
   BRA  start
Note “Branch optimisation” is one of the oldest tricks used by compilers, but modern processors may benefit more from the fact that the rarely used loop body is moved away from the “hot path”, so “cold path” code doesn’t pollute the instruction cache. (Modern processors rely heavily on caching as memory speeds have not kept up with increases in CPU speeds.)
How PGO helps
There are many ways that a compiler has to determine how to generate code based on some sort of heuristic. I suspect that compiler developers often just make “educated guesses” a lot of the time, but even if decisions are based on analysis of real code the compiler will always deliver code optimised for the general case.
PGO allows the compiler to generate code optimised for each case, using information on how the actual running code behaves.
Warning Of course, it relies on the “profile” used to guide the compiler to be representative of typical running production code.
In other words PGO allows the compiler, specifically the optimisation phase(s), to make more informed decisions about code generation.
Go
Go’s optimisations
Some of the best languages, like C, seem to give priority to efficiency above all else. One thing I love about Go is that it’s main focus is making it simple to write good code. Go code can be a little (IMHO about 25%) slower than equivalent code is C or Rust or Zig. Go code is still performant, but I believe Go gets the balance right.
PGO may be new to Go but the Go compiler has always performed “unguided” optimisations, such as:
- typical “micro” optimisations - see Optimizing Compiler (Wikipedia)
- special cases for Go - e.g
string/[]byteoperations - see Go Compiler Optimizations - escape analysis - see below
- function inlining - see below
Here’s a quick explanation of escape analysis and inlining as these are important for PGO. For a more detailed explanation I recommend Five Things that Make Go Fast.
Escape Analysis
Escape analysis is more an artefact of how Go works than an optimisation, though improvements made over many years have been important for performance.
Go is unique (AFAIK) in that the compiler decides whether a variable is stored on the stack or needs to be kept around on the heap. It is important for performance that, if possible, variables are kept on the stack rather than escape to the heap, since it takes more time to allocate but even worse it adds to the GC load. While a variable remains on the heap it is slowing down your program, because it has to be checked every time a garbage collection runs.
Note that PGO’s devirtualisation and better inlining help escape analysis, resulting in less things on the heap.
Inlining
When I first programmed in C, inlining was not even a thing. C used macros to allow you to accomplish the same effect. Go does not have macros so relies heavily on inlining. It’s probably Go’s most important optimisation technique.
Inlining allows the code of a (small) function to be inserted verbatim wherever it is called. (See Inline Optimisations in Go for a detailed explanation.)
Calling a function is pretty fast in Go, but if you call the same function millions of time in a loop then the overhead will add up. The overhead is due to various things that are done in the function call preamble, such as check if there is enough stack space. Some of this can be avoided (see //go:nosplit) but the function call and the preamble can be eliminated entirely if the function is inlined.
Even better, inlining functions allows opportunities for further optimisations including escape analysis.
Since inlining is so good, why isn’t it used everywhere? Obviously, there are some downsides to inlining, in particular memory use. It’s the classic space/time tradeoff - you can make things faster by using more memory and vice versa.
For a large function, there is not much to be gained, since the function call overhead is relatively small. There is also a lot to be lost in memory usage – if there are many call-sites the code for the function will be replicated at each one.
OTOH if you have a large function called many times (e.g. in a loop) at just one call-site it would be worth inlining it. Go does not currently take call-sites into account as it is tricky and may cause confusing behaviour.
So Go only inlines small functions – but how does it decide? In essence, the compiler tallies up all the operations that a function performs and if it does not exceed the inline budget then the function will be inlined.
Some operations preclude a function being inlined altogether, but over the years many of these restrictions have been lifted. For example, until recently, functions with loops could not be inlined and originally only “leaf” functions (functions that do not call other functions) could be inlined (see Mid-stack inlining)
Also see //go:noinline for more about inlining including the directive and command line flags.
Problems with Go’s Default Inlining
The default inlining (without PGO) is simplistic as there’s just one metric (the inline budget) used to decide whether a function is inlined or not. It does not look at the places in the code where the function is called. And the compiler can’t know (without a CPU profile and PGO) if the function is called once, or a million times in production.
Some functions may be inlined when they should not be. For example, a function to do logging may only be called in error-handling code. It may be called in many places (ie have many call sites) but is rarely, if ever, executed. If small enough it will be inlined at all call sites, leading to code bloat.
You could manually disable inlining on such a function using the //go:noinline directive).
OTOH functions may not be inlined when they should. For example, a function that slightly exceeds the inline budget will not be inlined even if it is called at a single call site. Inlining this function could have a large benefit if the call site is in a tight inner loop.
What is PGO?
Compilers optimise the code they generate for improved efficiency. These optimisations are based on static analysis of the code when it is compiled - see Background/Go above for more on Go compiler optimisations.
But compilers can generate even better results if they know how the code runs in production. The simplest way to achieve this is to perform dynamic analysis, or CPU profiling, of the executing software. See Background/General/How PGO Helps above for details.
Typically, this involves these steps:
- Compile the software (PGO not enabled)
- Run the software and generate a CPU profile under typical production conditions (called
default.pgo) - Compile the software using this CPU profile
- Use this version ongoing in production
Also see Wikipedia.
Why is optimisation Important?
Performance is not the main focus of the Go language. On the other hand Go is no slouch either which is why a lot of developers are drawn to it (whence, like me, they discover Go’s other great benefits previously unbeknownst to them :).
So, performance is important for many Go developers and PGO is an important advance for Go.
For example, I read recently that most of the code running on Google’s servers is built using PGO. When you consider that (my estimate) the electricity bill for all those servers must be approaching (if not exceeding) one billion dollars annually, PGO probably saves Google at least tens of millions of dollars every year. So it makes sense economically. It’s also good for the environment.
Go’s Cool PGO Features
Uses Existing pprof format
One of the often unrecognised benefits of Go is how many of the different parts – in the language, runtime, tools, etc – work so well together. It is, perhaps, no surprise that Go’s PGO integrates well with existing tools and procedures. For example, dynamic analysis of running Go code is simply a matter of generating a standard CPU profile (as recently discussed in CPU Profiling and Flame Graphs).
This means that a lot of tools and knowledge is readily available for use with PGO. For example, you can use existing tools to manipulate and merge CPU profiles to use with PGO-enabled builds.
Iterative Profiling
One of the major advantages of Go’s PGO is that you can generate profiles from previous PGO-enabled builds, to guide the next build. That is you can repeat steps 3 and 4 above repeatedly generating new profiles from production to be used with the subsequent build.
This is made possible by two features of Go’s implementation of PGO.
First, thanks to some recent Google research, Go’s PGO does not suffer from the problem of iterative instability. That is it avoids a type of “feedback” caused when profiling code that has already been PGO-enabled.
Second, it handles code changes better than many PGO implementations, by cleverly (but simply) preventing most code changes from invalidating a CPU profile generated with the previous build. So you can take a profile of the current production software to guide optimisation of the next build, as long as code changes are not large.
Warning If you make significant code changes you may need to follow all 4 PGO steps from What is PGO above. That is, you may need to profile the latest build of the software without PGO enabled, before rebuilding with PGO enabled. This may be necessary after a major refactoring of the code but could be needed after something as trivial as global renaming of a hot function.
These innovations are described more (care)fully in Design and Implementation of PGO for Go.
Architecture Independent
Generally you can apply the same CPU profile when compiling for different target environments. For example, a CPU profile generated on a Linux system should give similar results when applied to building the code for Linux, Windows, or any other architecture.
Warning This could change with additions to PGO in future Go releases.
There is one caveat. optimisations to code that targets a specific environment (e.g. using Build Tags) are only applied if the CPU profile was obtained from the target environment. If PGO optimisations are required for different targets then profiles would need to be generated for each environment (see Alternative Targets).
For example, if PGO optimisations were to apply to some file handling code which was OS specific, then a CPU profile would have to be generated on each OS. Thence when each OS specific version is built the relevant CPU profile can be used for PGO.
No Downside
In typical PGO implementations a poor CPU profile can reduce performance. This is one more disincentive to using PGO. Why risk it?
Luckily, Go’s implementation does not normally suffer this problem. So you can use PGO knowing you won’t make things slower. Of course, you should follow the guidance below to ensure you are getting the benefits.
Warning Future PGO optimisations may negate this advantage. Also, in theory, devirtualization using a really bad CPU profile could slow your code. Another possibility is code bloat due to too much inlining.
PGO optimisations In Brief
Inlining of Hot Functions
Inlining of functions is one of the most important optimisation tricks of the Go compiler. I explained inlining in Background/Go above, but for a full explanations have a look at Dave Cheney’s posts such as Mid-stack inlining in Go.
There are problems with Go’s simplistic approach (see Background/Go/Problems with Go’s Default Inlining above). In brief, it may not inline functions if they are called a lot (so-called hot functions) if they slightly exceed the inline budget. OTOH it can unnecessarily inline functions at many call sites results in more memory usage and also reduce the effectiveness of the CPU instruction cache.
PGO does several things to make inlining much more effective. First, it increases the inline budget of hot functions. It also inlines large hot functions only at hot call sites – ie, it does not inline the same function at sites where it is never/rarely called – reducing code bloat.
Moreover, PGO avoids inlining of functions that the CPU profile reveals to be cold functions. Again, this reduces unnecessary code bloat.
Note The pgoinlinecdfthreshold command line option tunes whether functions are considered to be hot or not. The pgoinlinebudget option allows you to set the budget for hot functions to be inlined.
Devirtualizing Method Calls
Calling a method through an interface is slower than a direct method/function call. A CPU profile may show that the underlying type used at a particular method call site is always/usually of a certain type (or a small number of types). The compiler can then optimise such call sites to use direct method calls for the specific type(s), while still allowing for calls through the interface for other types.
This is obviously a good idea, especially for code that uses a lot of interfaces, but it seemed to me there was lower-hanging fruit that could have been tackled first. It turns out that I was wrong, as devirtualisation allows further optimisations. In particular, it can prevent variables escaping to the heap, which is a very good thing.
As an example, here is code that calls the method f() through the interface i.
type I interface { f() }
...
    var i I
    ...
    i.f()
If CPU profiles shows that i.f() is called a lot (ie, is on a hot path) where i contains a value of type A, then the compiler could “devirtualise” the call to f() by modifying the code to be something like this:
    if a, ok := i.(A); ok {
        a.f() // direct call
    } else {
        i.f()
    }
Warning It may be tempting to make the above fix manually in the source code, rather than rely on PGO. This is generally a bad idea since it makes the code harder to understand. Moreover, usage of the code might change in the future (which later CPU profiles will reveal) negating the benefit of the change.
Instruction Memory Layout
CPU profiles allow the compiler to find the commonly executed or hot paths through the code. When PGO is enabled the Go compiler uses this information in two ways. The compiler will reorder blocks of code within a function, and (later in the build process) the linker will adjust the location of functions which determines where they are loaded into instruction memory.
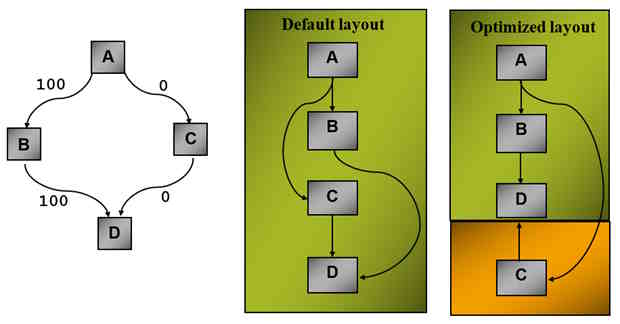
Block reordering moves blocks of code within a function. In the diagram below the code blocks B and C represent the alternative paths through an if - else or switch statement. Only one path is ever taken according to the CPU profile. Moving C away from the hot path greatly improves use of the instruction cache (and optimises branches too).
Function reordering is similar but looks at the whole program. Without PGO, functions are placed in instruction memory in a fixed order grouped according to their package. For example, a “hot function” (that can’t be inlined for some reason) is moved as close as possible to its hottest call site. Again this improves use of the instruction cache.
Future
The good news is that Go’s PGO gets good results with just these optimisations. The better news is that there is still a lot of room for more.
There are many opportunities for “micro” optimisations. For example, if a variable that is allocated on the heap, does not need to escape in the hot path, then the variable could be allocated on the stack and only moved to the heap if/when the cold path is taken.
One thing that is important (as generics become more used) is a feature referred to as stenciling. PGO could determine the type parameter when a generic function is called in a hot path and generate code specifically for that type (possibly even inlining it at the hot call site!).
Sometimes Go generics don’t have quite the performance benefits I hoped for. Stenciling is cool as it automatically provides better performance, which would require explicit coding (specialisation) in C++.
See the PGO opportunities umbrella issue for many more things being looked at.
A Few Gotchas
Line Oriented Profiles
Go’s CPU profiles only have line number resolution. Placing too much code on one source file line can hinder PGO.
For code that is called often: avoid calling multiple functions on one line, single-line if statements, single-line functions, etc.
This problem may be addressed in a future Go release - see cmd/compile: add intra-line discrimination to PGO profiles.
Code Changes Invalidate Profiles
PGO is pretty tolerant of code changes, but sometimes seemingly innocuous changes can cause problems.
Be careful of global renames, especially of commonly called functions. This is very easy to do without much thought in many IDEs.
A good practice would be to do all the “superficial” changes (e.g. changes to identifiers) that dos not change the behaviour of the code at once (and check them into version control together). After that do a “clean” build - ie, build without PGO enabled, then produce a clean profile, etc. as in steps 1 to 4 in What is PGO? above.
Similarly, do a “clean” build after a major code refactor or if a significant feature has been merged into the main/production branch.
Note that small changes to the source code of a function won’t invalidate a CPU profile from the previous build. Go’s PGO can even tolerate a function being moved to a different location or source file as long as it is not renamed or moved to a different package.
Version Control of Profiles
My general rule of thumb is that only files that are modified directly by people should be added to version control. (A lot of people disagree with this, but I have found it generally avoids confusion.) However, CPU profiles used by the compiler are an exception to this rule, especially if profiles are generated as part of an automated build process.
If you don’t commit the profile used to build the code then if somebody else checks out the code (or you check it out on a different machine) then you will get a different result when you build the code (ie without PGO optimisations).
Note that PGO will be silently used if there is a a CPU profile called default.pgo file in the source code directory.
Poor Profiles
The way you should generate CPU profiles for PGO may not be the way you are used to generating them. The accepted advice is they should be profiles typical of production software.
Don’t use a profile generated from a benchmark. No matter how important you think a particular function is to the performance, just profiling it will miss the main benefits such as function reordering (see Code Layout above) that operates on the whole program.
Profiles can also be inconsistent. Go software often uses a lot of concurrency which can make behaviour unpredictable.
There are also many other aspects to consider. For example, you may get better results using profiles generated under heavy load than those generated under average load. Moreover, some types of load, such as HTTP requests, may be more important than others. See the next section Profile Collection Guidance for how to generate good profiles.
Profile Collection Guidance
PGO depends heavily on the CPU profile provided to the compiler. Here are some tips on how to generate them but if you have not used profiling before see Generating CPU Profiles.
In this section I’ll occasionally refer to an example of a continuously running server, mainly because it is a real application on which I have done a lot of PGO testing, and because it is fairly typical of a Go server with different sources of potential load – HTTP requests coming in from “frontend” web-browsers, and large amounts of “backend” data coming in from various sources. There are also “cleanup” tasks that run regularly.
What is the “Best” Profile?
The general guidance is to generate CPU profiles in production under typical conditions. See Collecting representative profiles from production
The problem with this is that it may be difficult to discover and control variables in production. It may also be difficult to reproduce typical conditions. Moreover, “typical” conditions may not give the best results.
Remove External Factors
In production server environments there may be a lot of things happening which could affect the profile. You should try to minimise these factors if possible, but sometimes there are things you are not aware of or cannot control. The problem can be mitigated by generating a CPU profile over a longer period of time or merging profiles taken at different times (see Merging Profiles).
The approach I prefer is to generate profiles in a controlled test environment (see Controlled Profiling below). Of course, there is a risk that you have missed something and the test environment does not reflect important aspects of production. You also need to regularly check if changes to the software or the runtime environment require corresponding changes to the test environment.
Control Internal Factors
Creating profiles under typical load may not be the best approach since you probably want the best performance when the software is under heavy load. In my case the server has light load most of the time, but I get better results if profile(s) are generated under heavy load.
Of course there are problems with generating profiles when the server is under heavy load as the act of generating the profile will slow the server even more. However, this overhead has improved in recent releases.
A bigger problem is that the right conditions may rarely occur (or are difficult to detect) in production. This is another reason to create a controlled test environment.
Cleanup Tasks
My example server regularly runs cleanup tasks. These tasks are not run often and use very little CPU, but they could interfere with the gathering the CPU profile if they happen to run at the wrong time.
Warning On the other hand, if you have cleanup task(s) that run often and/or do a lot of work you may want to explicitly include them in the CPU profile. They should be optimised if they do a lot, or they will slow everything down.
Garbage Collection
It’s been suggested that Go runtime garbage collections interfere with CPU profile collection. I have not been able to produce any evidence either way in my tests. However, I don’t think it can hurt to turn off the garbage collector (using debug.SetGCPercent(-1)) while generating your profile(s).
If you automatically generate CPU profiles, you may need to add code that allows cleanup tasks and garbage collections to be controlled by the automated build process.
Alternative Targets
As mentioned above in Architecture Independent, you can compile with PGO for multiple targets using the same CPU profile. If optimisation of target specific code is important you must generate CPU profiles on each of the important targets. Thence you can either:
- merge all the profiles into one profile (eg
default.pgo) to use when building for all targets - use the CPU profile from each specific target when building that target
Controlled Profiling
I prefer to obtain CPU profiles in a controlled test environment. This allows control of external influences and to set up the type of load you want.
You may already have a test environment set up (as I do) that can be easily adapted to generate CPU profiles under carefully controlled conditions.
In my case, the most important performance aspect of the code is to handle HTTP requests in a timely manner even when under heavy load. There are also certain backend inputs that have priority. All other processing, including cleanup tasks can take a back seat. So to set up the “test” server used to generate the CPU profile I would:
- create a large load from a large number of frontend connections (using K6 tool)
- create a smaller load of priority backend inputs
- disable all cleanup tasks
This is run on a separate quiet test server and a CPU profile is generated over 30 seconds. The profile is then added to version control (as default.pgo) and picked up automatically for the next automated production build.
The only drawback is that builds are a bit slower.
With this setup you also need to be aware if the profiling process needs to be adjusted as things change. You could also set up automated tests to check that PGO is producing useful results…
Automated Verification
My next task is to set up automated benchmarks at each release. This would mean creating builds of the same code with and without PGO enabled and run some tests, to warn if PGO does not give latency improvements above a certain threshold (e.g. 20%). This would provide immediate feedback on problems with the build system especially the generation of CPU profiles.
Conclusion
PGO is a very useful addition to the arsenal of tools available to gophers. Further, the Go approach to PGO makes it easy to start using it. There are a few things to be aware of, especially in generating CPU profiles, to get the most from PGO.
If you automate the process of generating CPU profiles and check them in to version control they can become a transparent part of the build process.
Glossary
- budget - operation count threshold above which a function is not considered for inlining
- cold path - code that is never or rarely executed in practice (see hot path)
- devirtualisation - replacing a method call through an interface with a direct call on a specific type
- hot call site - the location in the code that a hot function is most often called from
- hot function - a function that is found to be called often by analysis of the CPU profile
- hot path - the path through code which is taken most often (from the CPU profile)
- inlining - replacing a function call with the “inline” equivalent to avoid function call overhead
- stenciling - replacing a generic function with specialised version using fixed type parameter(s)
Comments